The LLM API Price Landscape, Visualized (July 2026)

I spent an unreasonable amount of last week staring at model price sheets — cross-checking three trackers line by line for our July pricing survey. Somewhere around the fourth spreadsheet tab I noticed I could no longer feel the numbers. $0.075 and $30 sat in adjacent rows, same font, same row height, politely pretending to be peers.
That's the problem with tables. A table gives every row equal ink no matter how unequal the values are, and your eye reads the layout, not the magnitudes. A 400x gap between the cheapest and priciest input price looks like... two rows. So this post is the same data, drawn instead of listed. Same nine models, same numbers as the survey. Three charts.
1. The spread only fits on a log scale
Here is the input price per million tokens, and I have to be honest about the axis before you look: it's logarithmic. Each gridline is 10x the last. On a linear axis this chart is useless — GPT-5.5 Pro's bar is the chart, and seven of the other eight models become an unreadable smudge near zero. I tried it. It looked like a barcode.
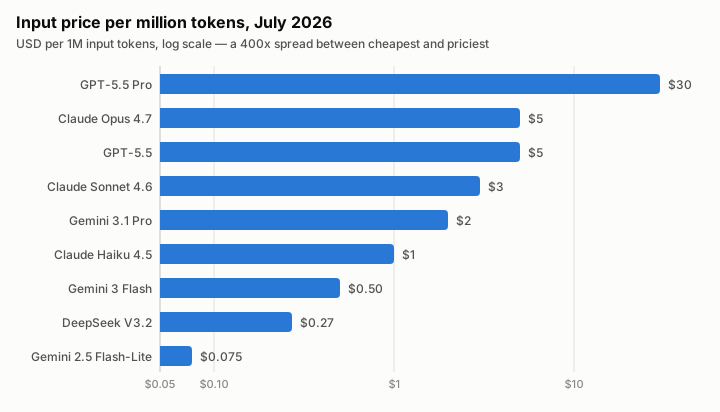
Two things I didn't appreciate until I drew it. First, the bars are roughly evenly spaced on the log axis — the market has settled into a multiplicative ladder, where each rung down is about half the price of the one above, all the way from $30 to $0.075. Nobody planned that; it emerged. Second, the models most teams actually run in production — the $1–$5 band — occupy a fairly narrow stripe in the middle. The drama is at the ends: one very expensive outlier, and a crowded, aggressively cheap floor.
2. The output tax is a flat 4–6x, everywhere
Every provider charges more for output tokens than input tokens. Fine — generation costs more to serve than prefill. What surprised me is how uniform the markup is:
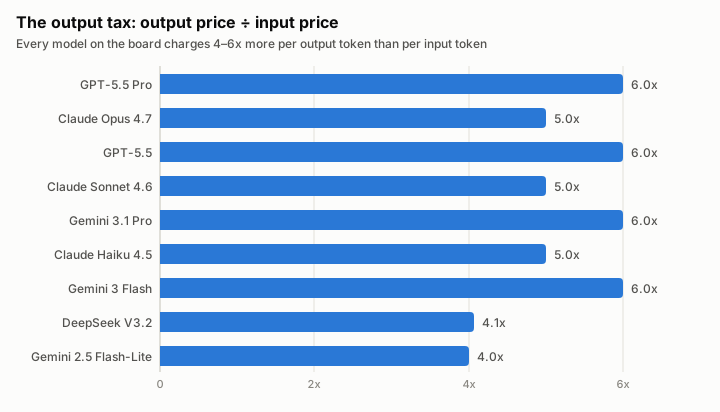
Nine models, four providers, one narrow band: 4x to 6x. OpenAI and Google sit at 6x, Anthropic at a tidy 5x across all three Claude tiers, and the budget floor (DeepSeek, Flash-Lite) at 4x. That consistency smells like convention, not cost accounting — and conventions are exactly the kind of thing that quietly reprice your product. If your workload generates long answers, code, or reports, the output column dominates your bill no matter which model you pick, and switching providers won't save you from it. We wrote up how output-heavy workloads (and tokenizer changes) inflate bills in The Tokenizer Tax; the short version is that the right optimization is usually shorter outputs, not a cheaper model.
3. What a month actually costs
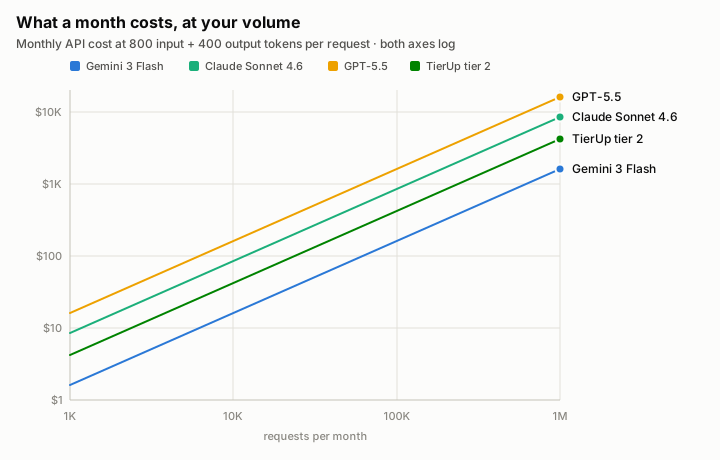
Per-token prices are abstract to the point of anesthesia. Nobody's budget is denominated in millionths. So here's the same data as monthly bills, for a workload of 800 input + 400 output tokens per request — a decent stand-in for a chat turn or a RAG answer:
The formula behind every line, worth pinning somewhere:
monthly cost = requests/month × (800 × input $/M + 400 × output $/M) ÷ 1,000,000
Worked example, Claude Sonnet 4.6: 800 tokens × $3/M is $0.0024 of input, 400 tokens × $15/M is $0.0060 of output — $0.0084 per request. At 50,000 requests a month, that's $420/mo. Notice the output line item is 2.5x the input one, from half as many tokens. Chart 2, showing up on your invoice.
On log-log axes the lines are straight and parallel, which is itself a finding: per-token pricing has no volume curve. Your ten-millionth request costs what your first did (batch and caching discounts aside). The only thing that moves you between lines is the model name in your config.
Where each model crosses $100/month
Same formula, solved for the volume where the bill hits $100/mo — a useful "this just became real money" threshold:
| Model | $/request | Requests/mo to hit $100 |
|---|---|---|
| GPT-5.5 Pro | $0.0960 | ~1,042 |
| GPT-5.5 | $0.0160 | ~6,250 |
| Claude Opus 4.7 | $0.0140 | ~7,143 |
| Claude Sonnet 4.6 | $0.0084 | ~11,905 |
| Gemini 3.1 Pro | $0.0064 | ~15,625 |
| TierUp tier 2 | $0.0042 | ~23,810 |
| Claude Haiku 4.5 | $0.0028 | ~35,714 |
| Gemini 3 Flash | $0.0016 | ~62,500 |
| DeepSeek V3.2 | $0.000656 | ~152,439 |
| Gemini 2.5 Flash-Lite | $0.00018 | ~555,556 |
Read it as a stress test for your roadmap. About a thousand Pro-tier requests — thirty-odd a day — is a $100 bill. The same hundred dollars buys half a million Flash-Lite calls. Whether that 500x range maps to a 500x quality difference for your workload is the question worth a week of evals, and mostly it doesn't.
Where we sit, stated plainly
TierUp tier 2 is the green line in chart 3: $1.50/$7.50 per million, about half the retail price of the Sonnet-class models it routes to. The honest footnotes: we route through OpenRouter today, and that pricing is transparently subsidized while we test product–market fit — capped by a daily guardrail, disclosed on every page including this one. It's a funded experiment, not secret efficiency. If you need to pin an exact model, call the provider directly and pay the rack rates in chart 1.
If you want these curves for your own token mix instead of my 800/400 guess, the cost calculator does the arithmetic live, with the same numbers. The full price table with sources and footnotes is in the July 2026 pricing survey. And if the middle of chart 3 is where your workload lives, try tier 2 free — no card, $25 of credit, see where your line lands.